I asked ChatGPT the same "who is the best" question in 216 US markets, then asked again 4-9 days apart. Only 48.2% of the businesses it showed the first time were still shown the second time (469/974).
of the businesses ChatGPT showed still appeared when I asked the identical question in the same market 4-9 days apart (469/974 shown businesses).
In August 2026 I ran two instrumented studies over the same frozen grid of 12 services and 18 US cities. One watched ChatGPT's local panel. The other watched Google's AI Overview for the identical questions. Here is what came back.
On ChatGPT's local panel across 216 US markets in August 2026, only 48.2% of shown businesses (469/974) survived when I asked the identical question 4-9 days apart. Just 34.1% of markets (73/214) kept the same #1. Mean panel overlap was 0.36 Jaccard.
Across those same 216 markets, the churn traced back to retrieval rather than the model changing its mind. Retrieved-domain overlap between waves was just 0.20 Jaccard (n=197). When ChatGPT re-encountered a business it had shown before, it showed it again 72.5% of the time (469/647).
On ChatGPT's local panel in wave one, 17.4% of displayed ratings that resolved to one platform were Yelp's (139/799). The Yelp burst logo predicted a validated Yelp rating on 138/138 resolved cards. The Request-a-Quote button did not: 114/114 button-only cards carried Google's numbers.
Across everything ChatGPT considered in these 216 markets (6,024 candidates, 1,946 shown, 428 market-waves), an in-city address carried a descriptive odds ratio of 14.4, 95% CI [10.3, 21.5]. That is ahead of rating (1.36 per +0.1 star) and review volume (1.81 per doubling). Descriptive, not causal.
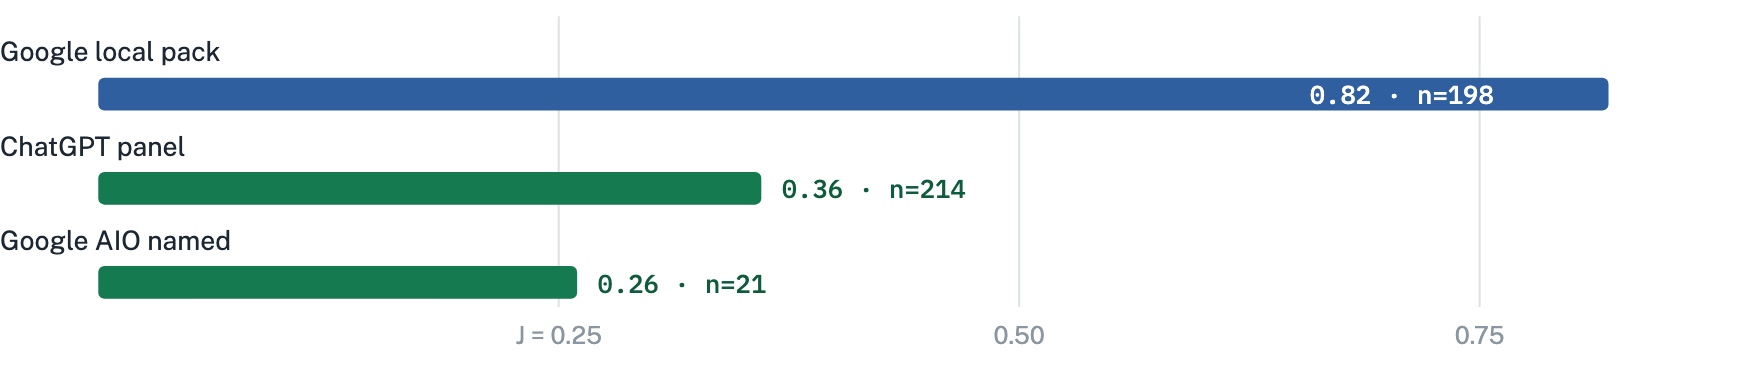
Comparing wave-to-wave overlap on the same 216-market grid in August 2026: Google's local pack held at 0.82 Jaccard (n=198), ChatGPT's panel at 0.36 (n=214), and the set of businesses Google's AI Overview names at 0.26 (n=21). And the AI Overview fired on only 25.9% of these local buying queries at all.
Identical question, identical market, 4-9 days apart, 214 paired markets. Mean panel overlap was 0.36 Jaccard (median 0.33, 95% CI [0.33, 0.39]). A Jaccard of 1.0 would mean the same list both times; 0 would mean no shared names at all.
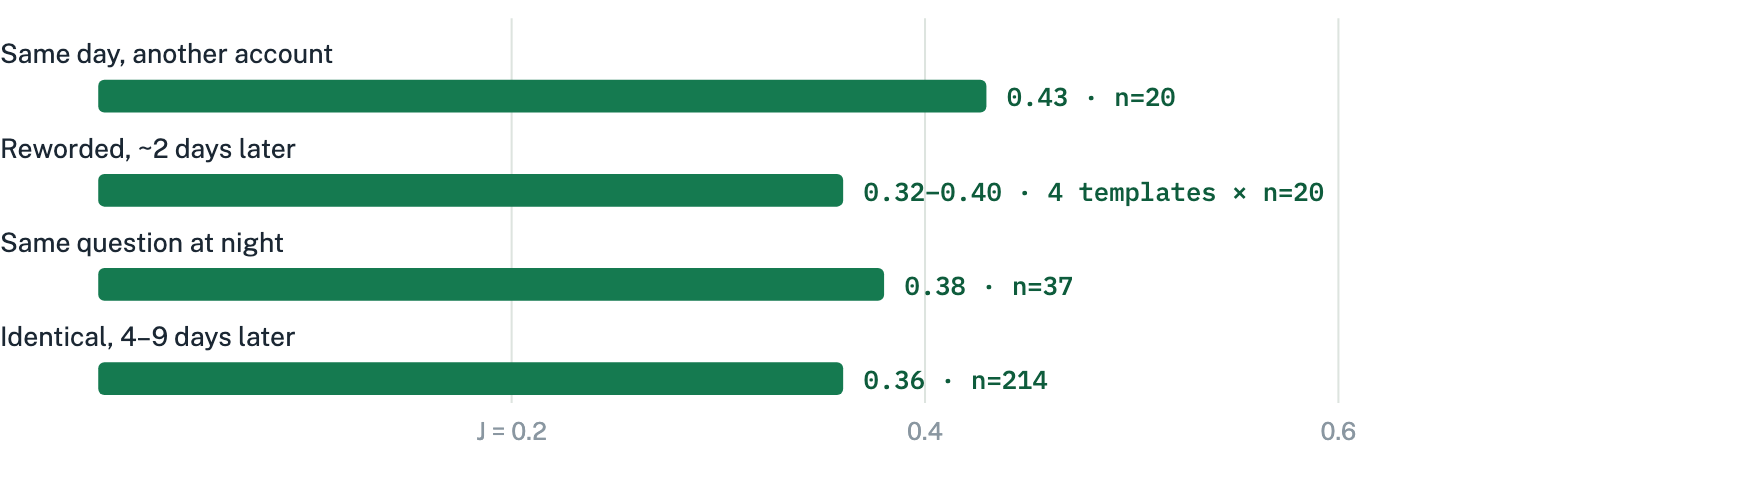
A wave-one business survived to wave two 48.2% of the time (469/974, CI [44.5%, 51.8%]). The same #1 held in 34.1% of markets (73/214, CI [27.6%, 40.2%]). And the instability showed up at every horizon I tested, not just the week-apart one.
Mean displayed-panel Jaccard vs the same market's wave-one panel, ChatGPT's local panel, 216-market grid, August 2026. Even a same-day ask on a second account agreed only 0.43 [0.30, 0.55] (same #1 in 6/20 = 30.0%). The night arm held the same #1 in 13/37 = 35.1% of markets. Gap-day strata within 4-9 days were flat (mean J 0.30-0.42).
What churns is who gets picked, not the numbers on screen. Panel size barely moved (mean delta +0.05 cards, unchanged in 85/214 = 39.7% of markets). Displayed ratings barely moved either: 60/467 = 12.8% changed, with a mean shift of 0.037 stars. Order among the survivors was loosely kept (Kendall tau median 0.67 across the 144 pairs with at least two shared cards).
The night arm has a plain mechanism. Among displayed businesses in those 37 markets, 152/162 = 93.8% were open at ask time during the day, vs 51/162 = 31.5% at night. The evening panel swaps toward different businesses.
A one-time "you're #1 on ChatGPT" claim describes one roll of the dice. Presence has to be measured over repeated asks to mean anything.
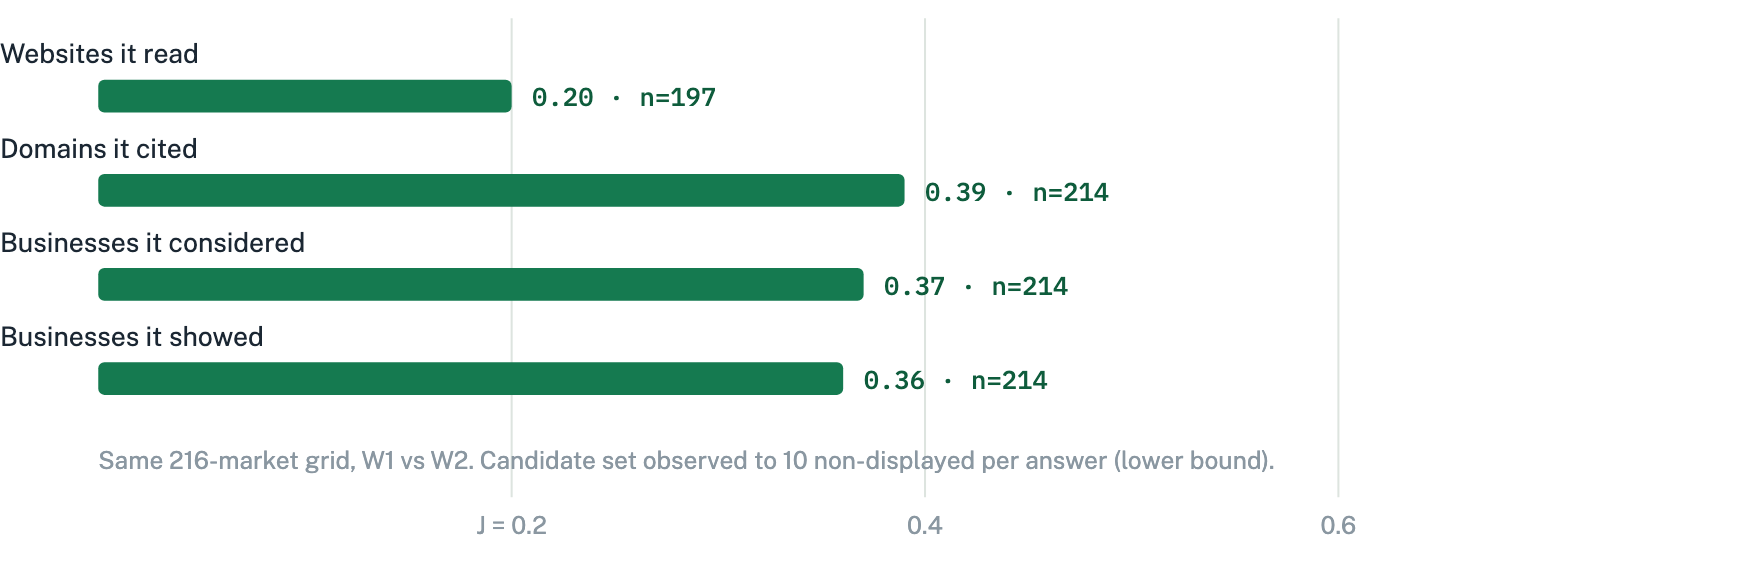
This section was computed after the main results were unblinded, so I label it post-hoc. It traces the wave-to-wave overlap layer by layer through ChatGPT's pipeline for the same 214 market pairs.
The websites ChatGPT retrieved for the answer overlapped at just 0.20 Jaccard between waves (95% CI [0.16, 0.24], n=197). The domains it actually cited overlapped at 0.39 [0.35, 0.44], the businesses it considered at 0.37 [0.34, 0.39], and the displayed panel at 0.36 [0.33, 0.39] (all n=214). The churn starts at the bottom: the search leg reads mostly different pages each time.
Two numbers close the argument. A wave-one business re-appeared in wave two's observed candidate set only 66.4% of the time (647/974). That is a lower bound, because the candidate set is observed to 10 non-displayed businesses per answer. But when ChatGPT re-encountered a business it had shown before, it showed it again 72.5% of the time (469/647), vs 21.5% (515/2,399) for candidates it had not shown. The model's taste is fairly consistent. Which websites the search leg reads, and therefore which businesses even reach the model, is what changes ask to ask.
| Wave-one displayed businesses | Survived (n=469) | Dropped (n=505) |
|---|---|---|
| Median reviews | 226 | 164 |
| Was the #1 card | 30.7% | 13.9% |
| Median search rank | 6 | 8 |
| In-city address | 93.4% | 89.9% |
| Median rating | 4.9 | 4.9 |
Survivor vs dropped profile among wave-one displayed businesses, ChatGPT local panel, August 2026. The ratings are identical. The review counts are not.
One more thing moves under your feet: among businesses shown in both waves, 75/469 = 16.0% flipped which platform's rating ChatGPT displayed, switching between Yelp's numbers and Google's. Both profiles carry weight.
Across both ChatGPT waves I compared every business the model displayed against the candidates it considered but did not display: 6,024 candidates, 1,946 shown, 428 market-waves. These are descriptive odds ratios. They describe who got shown in this window, not why. Nothing here is an experiment, and nothing here proves cause.
| Signal on the candidate | Descriptive odds ratio | 95% CI |
|---|---|---|
| Address in the asked city | 14.4 | [10.3, 21.5] |
| Yelp logo on the card | 3.31 | [2.35, 4.46] |
| Reviews, per doubling | 1.81 | [1.71, 1.94] |
| Rating, per +0.1 star | 1.36 | [1.26, 1.49] |
| Service word in the name | 1.23 | [1.02, 1.50] |
| GBP tags, per tag | 1.02 | [0.99, 1.05] |
Within-market conditional logit, ChatGPT local panel, waves one and two, August 2026 (6,024 candidates, 1,946 shown, 428 market-waves). Descriptive only.
The in-city gap is visible without any model: 92.0% of displayed businesses had an address in the asked city (1,790/1,946) vs 73.9% of observed non-displayed candidates (3,020/4,086).
There is also a visible entry bar. The median panel-minimum rating was 4.8 in every city tier. The median panel-minimum review count was 72 in major metros, 95 in mid metros, 62 in suburbs, and 50 in small cities.
And the model does not simply parrot search order. The median answer drew on 16 candidates (p10 9, p90 19; n=429 answers). Retrieval's #1 was displayed 62.2% of the time (267/429), but it was the panel's #1 in only 29.7% (127/428).
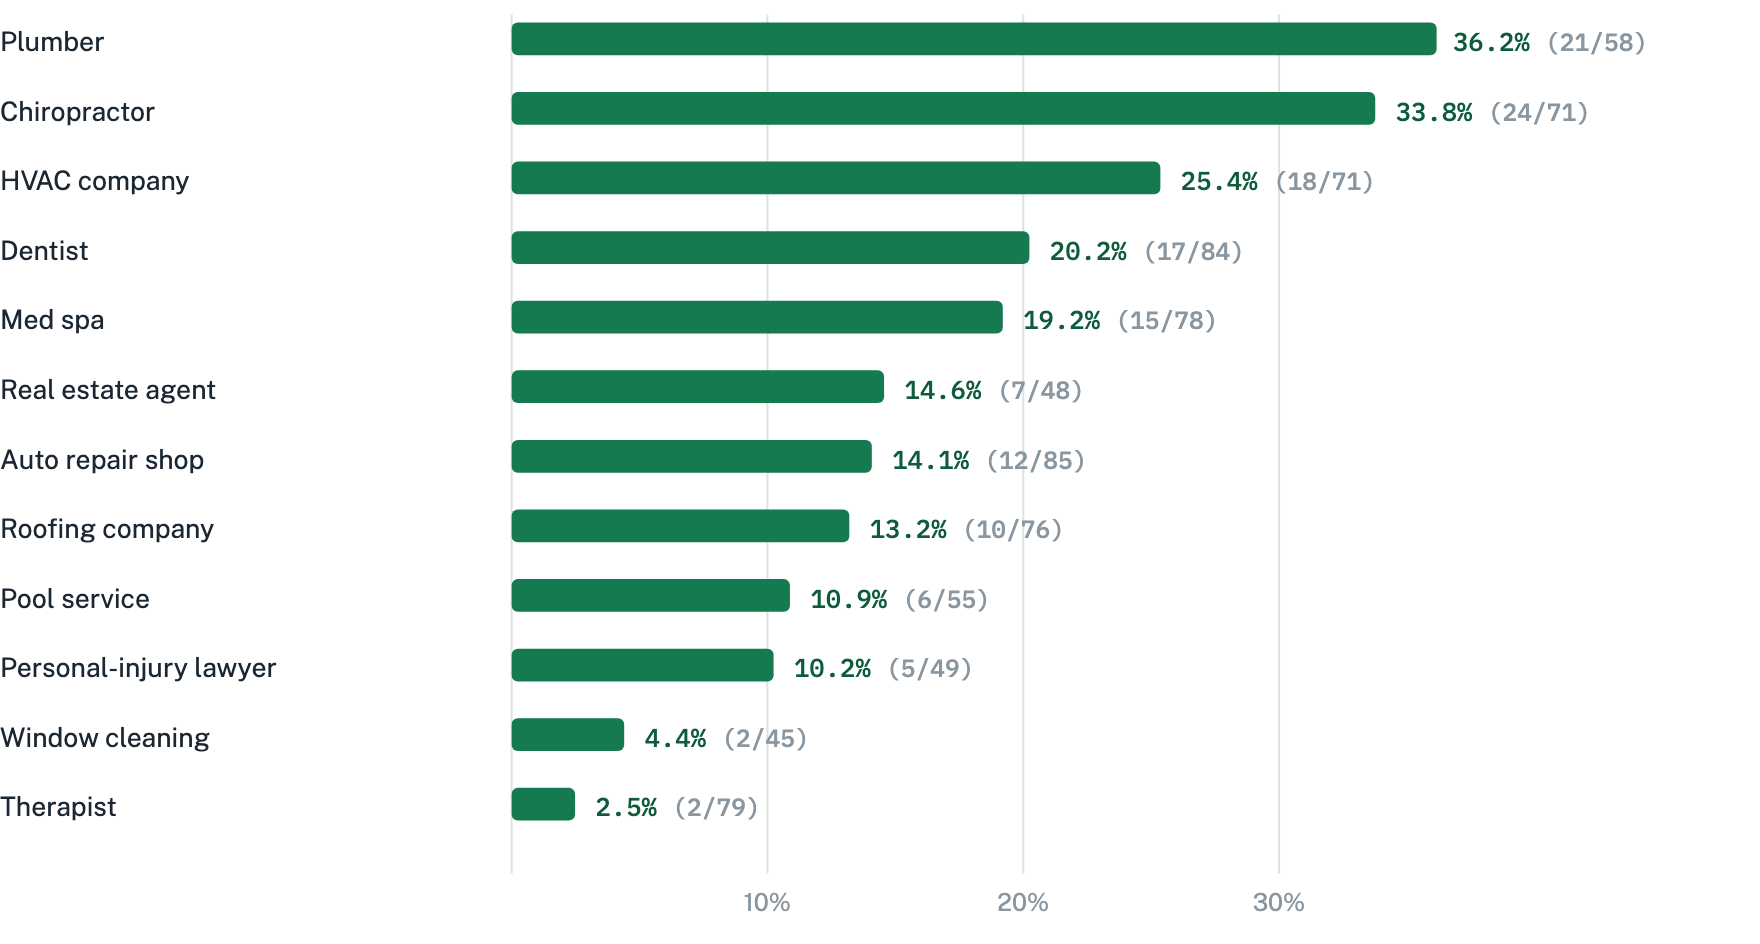
I validated every displayed card's rating and review count against same-day snapshots of both Yelp and Google. Among wave-one cards that resolved to exactly one platform, 17.4% showed Yelp's numbers (139/799, 95% CI [13.6%, 21.8%]). The rest showed Google's.
The remainder is reported, not dropped: 150/975 cards matched neither platform, 24/975 were unresolved, and 2/975 matched both. A 50-card hand audit of the automated match agreed on 49/50, so the percentage ships as a percentage.
Two visual tells behaved very differently. The Yelp burst logo meant a validated Yelp rating on 138/138 resolved cards. The Request-a-Quote button alone meant Google's numbers on 114/114. The button is a lead-routing integration, not a rating source.
Validated Yelp share of resolved displayed cards by vertical, ChatGPT local panel, wave one, August 2026 (18 markets per service). Geography beats city size: the three highest-share cities were all coastal Southern California. Los Angeles 42.3% (22/52), Long Beach 39.1% (18/46), Cerritos 37.2% (16/43).
Every vertical has its own reading list, and the churn decomposition above is why the list matters. You cannot control which pages the search leg pulls on a given day. You can be on more of them.
The most-retrieved domains across 215 wave-one markets: reviews.birdeye.com in 37.7% of markets (81/215), angi.com 24.2%, expertise.com 21.9%, doctor.webmd.com 18.1%, homeadvisor.com 17.7%, zocdoc.com 16.3%. The most-cited: reviews.birdeye.com 19.5% (42/215), expertise.com 16.3%, threebestrated.com 13.0%.
| Vertical | Most-cited domain | Share of that vertical's markets |
|---|---|---|
| Therapist | psychologytoday.com | 18/18 = 100% |
| Real estate agent | zillow.com | 17/18 = 94.4% |
| Personal-injury lawyer | attorneys.superlawyers.com | 15/18 = 83.3% |
| Window cleaning | angi.com, then threebestrated.com | 9/17 = 52.9% and 8/17 = 47.1% |
| Pool service | threebestrated.com | 9/18 = 50.0% |
| Dentist | reviews.birdeye.com | 9/18 = 50.0% |
| Chiropractor | reviews.birdeye.com | 8/18 = 44.4% |
| HVAC company | consumeraffairs.com | 8/18 = 44.4% |
| Plumber | bestprosintown.com | 8/18 = 44.4% |
| Auto repair shop | carfax.com | 6/18 = 33.3% |
| Roofing company | expertise.com | 6/18 = 33.3% |
| Med spa | medspascout.com and discovermedspa.com | 5/18 = 27.8% each |
Top cited domain per vertical, ChatGPT local panel, wave one, August 2026. Share = share of that vertical's 18 markets (window cleaning captured 17). For real estate, the top three domains covered 85.9% of citations (73/85).
For the same 216 markets I captured city-targeted Google SERP data across two waves in August 2026. The AI Overview mostly does not fire for local buying queries: it appeared in 25.9% of markets overall (CI 22.8-29.3%).
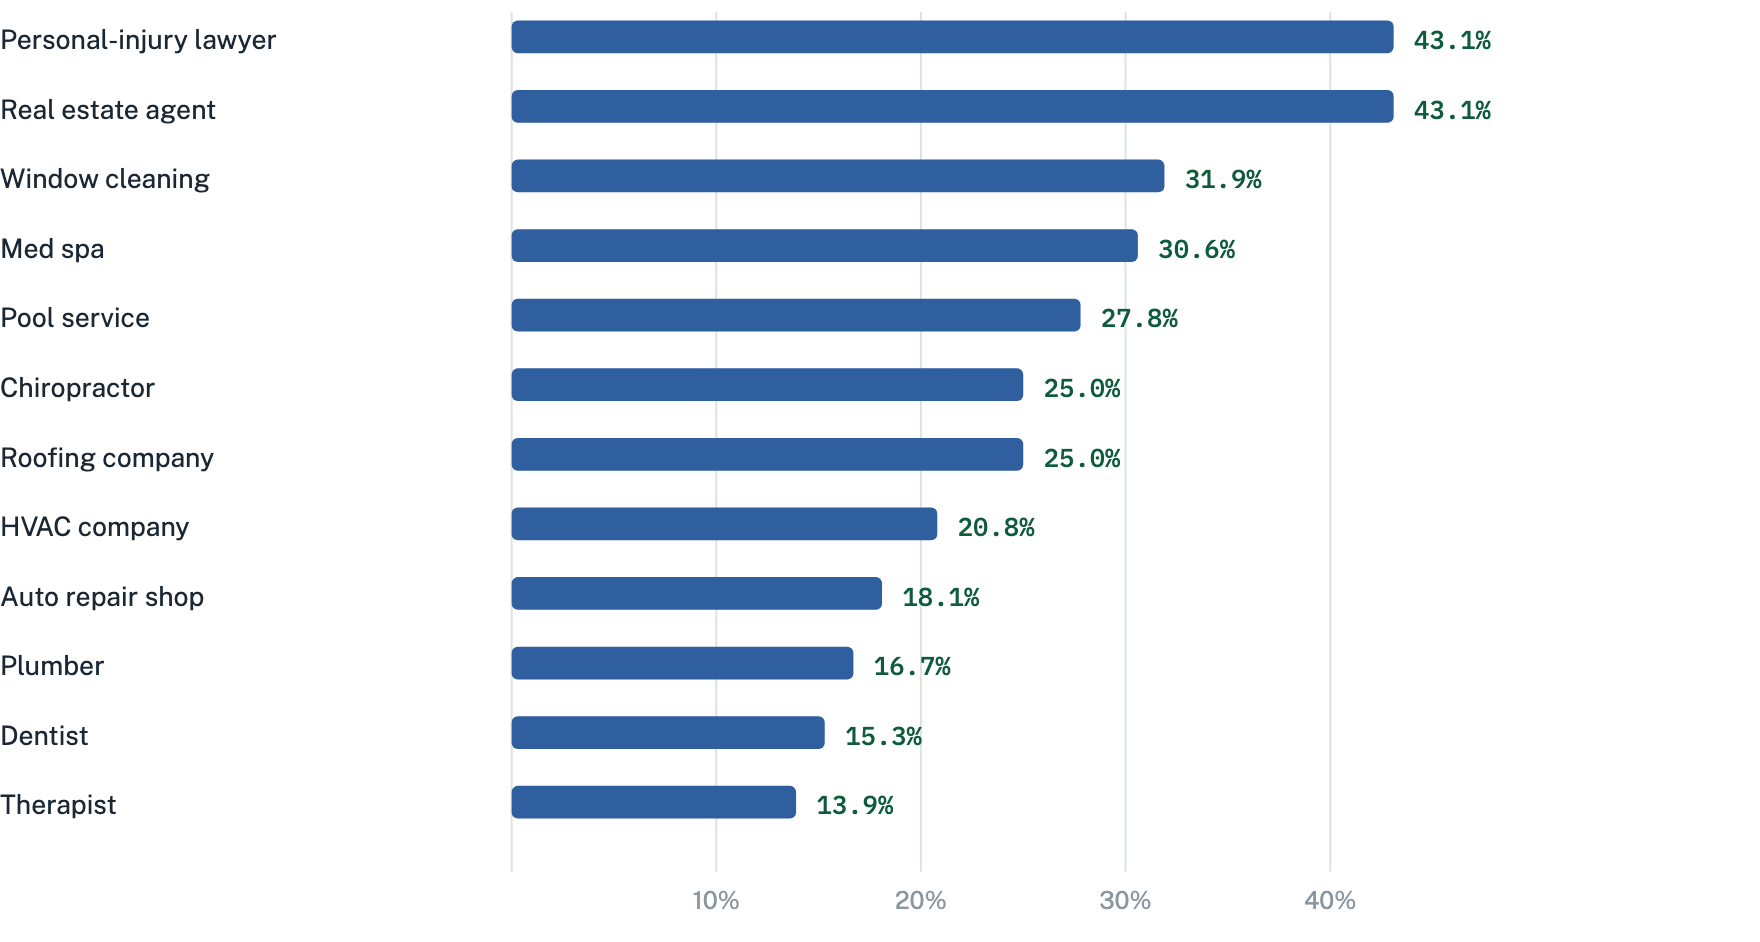
Phrasing tripled it. The question form ("who is the best...") triggered an AI Overview 39.1% of the time vs 12.7% for the keyword form ("best service in city"). It also grew during the study, from 20.6% in the first wave to 31.2% three days later. The verticals at the top were personal-injury lawyer and real estate agent at 43.1% each; therapist (13.9%) and dentist (15.3%) sat at the bottom (18 markets each).
When it fires, it names about 1.8 businesses (max 5, across 215 content-loaded AI Overviews), and 87.6% of those names were already in the same page's local pack (CI 82.9-92.1%, n=127 markets). Its citation economy points home: 1,182 of 1,683 citations went to google.com itself, with yelp.com a distant second at 54. Google's AI Mode, the full conversational surface, answered on 216/216 captures.
The stability ladder: wave-to-wave overlap (Jaccard) of the same surface for the same question, computed in one identity space, 216-market grid, August 2026 (n=198, 214, and 21 markets). The classic pack barely moves. Both AI layers churn.
Joined by business identity, never merged: when ChatGPT displayed a business, Google's AI Overview named the same business 14.2% of the time (138/975). The reverse held 50.5% of the time (138/273). ChatGPT's picks overlapped Google's local pack on 33.1% of displayed cards (323/975), and 40.2% of pack businesses appeared in ChatGPT's panel (323/803). Same question, different shortlists. Winning one engine does not carry the other.
The ChatGPT observations come from the ChatGPT web app's own responses to the study questions. The Google observations come from city-targeted Google SERP data for the same 216 markets.
A fixed grid of 12 local services across 18 US cities, 12 x 18 = 216 markets. The same question template ran in every market: who is the best {service} in {city}.
August 18 to 28, 2026. The two main ChatGPT waves asked the identical question in each market 4-9 days apart. Findings describe that window.
One pinned model on a consumer plan tier, with Memory off and no personalization. Asks happened on weekdays during business hours in each city's own time zone, plus one small comparator arm that asked at night.
Every displayed business card was validated against same-day Yelp and Google snapshots using a fixed match hierarchy. On top of that, a 50-card hand audit, drawn with a fixed seed before results were compiled and checked by the study operator against live pages, agreed on 49 of 50 cards.
With market-unit bootstrap intervals. The market, not the individual business card, is the unit of resampling, so cards from the same answer are never treated as independent.
From city-targeted Google SERP data captured for the same 216 markets, using two query forms per market across two waves.
One pinned model, one plan tier, one phrasing family (the rephrasing arm covered four variants on 20 markets). The candidate set behind the shown-vs-considered comparison is observed to 10 non-displayed businesses per answer, so the re-encounter rate is a lower bound.
Wave-two gaps ran 4-9 days rather than a uniform interval, and wave two ran from a different network. Both were accepted in advance: the prompt's city, not the searcher's location, drives the panel (in the pilot, 447/447 cards resolved to the prompt's state).
The churn-mechanism decomposition and the appendix cuts were computed after unblinding, and they are labeled post-hoc wherever they appear. The 50-card hand audit was performed by the study operator, not an independent third party. The AI Overview trigger rate was volatile within the study itself (20.6% in the first wave, 31.2% three days later).
Above all: the study window was one week in August 2026. These findings describe that window, not all time. Given the churn the study measures, that caveat is the point.
Everything above stands on its own. This section is my read of it, as someone who does this work for owners every week.
You can't hold a rank in AI search. You can only be worth recommending every time it looks, and be everywhere it looks.
Being worth recommending is measurable. The businesses that stayed in ChatGPT's answers were the ones with review depth: survivors had a median of 226 reviews vs 164 for the businesses that dropped, at identical 4.9 medians. Review volume at a near-perfect rating is the measurable residue of caring about customers, and in this data it is what keeps businesses in AI answers. That is reputation work, done steadily, long before any AI looks at you.
Being everywhere it looks means coverage. ChatGPT pulled a mostly different reading list on every ask, so the durable move is being present across your vertical's whole directory list, both profiles current on Google and Yelp, and your local search foundation strong, because Google's local pack was the one stable surface in the entire study (0.82 Jaccard, n=198). This is the ground AI search optimization is built on.
And measure repeatedly. A single screenshot of an AI answer describes one day. Presence over repeated checks is the number that means something. To be clear, none of this says there is nothing you can do. The signals in this study are exactly the things a business can build.
If you want the practical versions of this, I wrote up how to get recommended by ChatGPT and what AI search optimization is in plain terms.
This study is the method behind two things we do for businesses.
An audit of who AI shows for your market and where you stand: which businesses ChatGPT and Google's AI surface for your buyers' questions, whose ratings appear, which directories feed the answers, and where you are present or absent across all of it.
Because a single check is a coin-flip snapshot, we measure presence over repeated checks. You see how often you appear, how that trends, and which surfaces you hold, the same way this study measured it.
Journalists and researchers are welcome to cite this study with attribution to Spearleaf. Static versions of the charts, and the numbers most worth quoting, are below.
The stability ladder (PNG)
Churn by comparison horizon (PNG)
Where the churn comes from (PNG)
Yelp share by vertical (PNG)
AI Overview trigger rate by vertical (PNG)
The full study (PDF)
48.2% of ChatGPT-shown businesses survived 4-9 days (469/974)
34.1% of markets kept the same #1 (73/214)
17.4% of resolved displayed ratings were Yelp's (139/799)
In-city descriptive odds ratio 14.4, 95% CI [10.3, 21.5]
Stability ladder: local pack 0.82, ChatGPT panel 0.36, AIO 0.26
Google's AI Overview fired on 25.9% of local buying queries
The study tells you how the machine behaves. Your AI visibility report tells you where you stand in it, and what building presence would take.
Get your AI visibility report